
Climate in Valencia
(Spain)
Average daytime and nighttime temperatures

All climate diagrams on this site result from the collected data from five measuring weather stations in Valencia.
All data correspond to the average monthly values of the last 20 years. Country data: Spain
Climate for all Spain
With an average daily maximum temperature of 24 degrees, Valencia is one of the warmer regions in Spain. For several months of the year, it is warm to hot at temperatures continuously above 25 degrees, sometimes up to 32 degrees. Due to the warmer temperatures, the best time for traveling is in August. Less attractive are the cold months from November to April.
Mean temperatures
The mean temperature is determined around the clock, including at night. The temperatures are usually measured between 6 and 24 times a day and summarized as an average. The average annual temperature in the region of Valencia is 19 degrees Celcius. It is highest in August at 27 °C and lowest in January.
Sunshine hours per day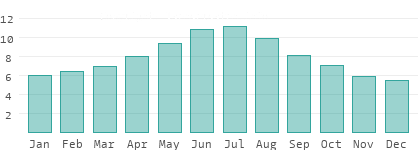
The number of hours of sunshine refers to the time when the sun is actually visible. That is, without any obstruction of visibility by clouds, fog or mountains. With 11 hours per day, July is the sunniest month in the region of Valencia. In December, the sun shines the least.
Rain days per month

A rain day is a day on which at least 1 mm of precipitation (=1 liter) per square meter falls. This can be rain, snow, hail, or even dew. So it doesn't have to rain all day. With 5 rain days, March offers the most rain days, while July has the fewest.
The threshold of 0.1 mm, or 1 liter, was set by the World Meteorological Organization (WMO). In the US, the limit is 0.1 inches, or 2.54 mm. In other countries, 0.1 mm (~0.004 inches) is sometimes used. We use the internationally accepted version of the WMO here.
The threshold of 0.1 mm, or 1 liter, was set by the World Meteorological Organization (WMO). In the US, the limit is 0.1 inches, or 2.54 mm. In other countries, 0.1 mm (~0.004 inches) is sometimes used. We use the internationally accepted version of the WMO here.
Precipitation amount in mm/day

The amount of precipitation is measured in millimeters per square meter. Thus, at two mm/day, two liters of water fall on one square meter within 24 hours. With only 0.3 mm, the least amount of rain falls in July. September, on the other hand, has the most rain.
Climate charts for other regions in Spain

Most important cities in the region "Valencia"
The region has a west-east extension of about 150 km and over 290 km from north to south.The positions of the weather stations used for the above climate evaluations are also marked on the map.
| City | Population | Geo position | |
|---|---|---|---|
| Valencia | 788,842 | 39° 28' 11"N | 0° 22' 39"W |
| Alicante | 338,768 | 38° 20' 43"N | 0° 28' 53"W |
| Elche | 235,566 | 38° 15' 44"N | 0° 42' 4"W |
| Castelló de la Plana | 172,637 | 39° 59' 8"N | 0° 2' 58"W |
| Orihuela | 86,164 | 38° 5' 5"N | 0° 56' 38"W |
| Torrevieja | 83,740 | 37° 58' 43"N | 0° 40' 56"W |
| Gandia | 80,020 | 38° 58' 0"N | 0° 10' 60"W |
| Torrent | 78,543 | 39° 26' 13"N | 0° 27' 56"W |
| Benidorm | 71,034 | 38° 32' 17"N | 0° 7' 52"W |
| Sagunto | 66,070 | 39° 40' 60"N | 0° 16' 0"W |
| Paterna | 64,023 | 39° 30' 0"N | 0° 25' 60"W |
| Groa de Murviedro | 62,368 | 39° 38' 30"N | 0° 14' 20"W |
| Alcoy | 61,552 | 38° 42' 20"N | 0° 28' 28"W |
| Elda | 55,168 | 38° 28' 40"N | 0° 47' 30"W |
| San Vicent del Raspeig | 53,126 | 38° 23' 47"N | 0° 31' 32"W |
| Vila-real | 51,205 | 39° 56' 18"N | 0° 6' 3"W |
| Alzira | 44,690 | 39° 8' 60"N | 0° 25' 60"W |
| Denia | 44,464 | 38° 50' 27"N | 0° 6' 21"E |
| Mislata | 43,756 | 39° 28' 31"N | 0° 25' 6"W |
| Burjassot | 38,433 | 39° 30' 35"N | 0° 24' 48"W |
| Ontinyent | 37,735 | 38° 49' 19"N | 0° 36' 22"W |
| Villena | 35,222 | 38° 38' 14"N | 0° 51' 56"W |
| Burriana | 34,565 | 39° 53' 20"N | 0° 5' 6"W |
| Villajoyosa | 33,797 | 38° 30' 27"N | 0° 14' 0"W |
| Santa Pola | 31,760 | 38° 11' 30"N | 0° 33' 57"W |
Population refers to the city proper, not metropolitan areas.
Data basis: German Weather Service, individual values averaged and supplemented by own elements. Data on cities and inhabitants: geonames.org, United Nations Statistics Division and own research.